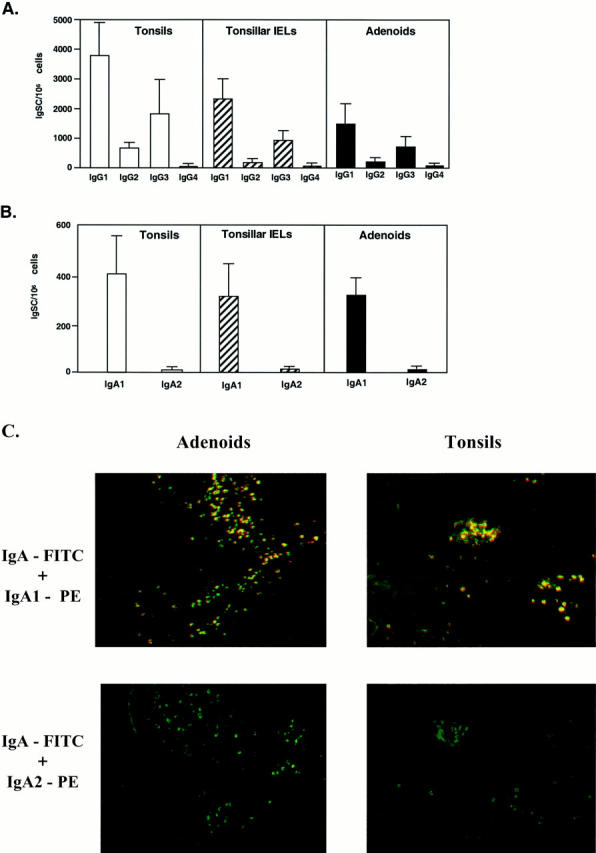
Figure 4.

The pattern of IgG (A) or IgA (B) subclass responses in adenoids and tonsils. The distribution of IgSC in freshly isolated human tonsil (□) or adenoid (▪) mononuclear cells or tonsillar IELs (▨) was determined by isotype-specific ELISPOT assays. The distribution of IgG subclass IgSCs (A) and of IgA1 and IgA2 subclass IgSCs (B) are expressed as the mean ± 1 SD (n = 13). In C, the immunofluorescent staining of IgA subclasses in tissue sections of adenoids and tonsils is presented. Paraffin sections were stained with FITC-labeled anti-IgA and PE-labeled anti-IgA1 or anti-IgA2. Original magnification, ×100.
