
Figure 6.
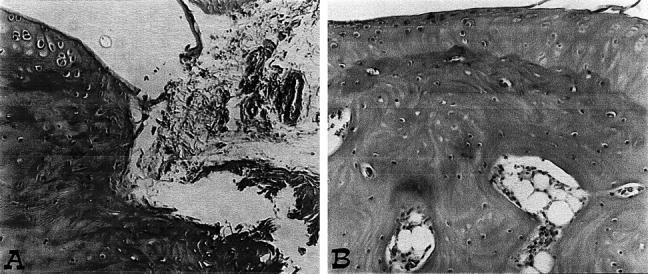
Representative histology of the inflammatory cells infiltration and bone erosion (A) of an arthritic animal. Note the reduction in the degree of inflammatory cells infiltration (B) in the paws of the calpain inhibitor I -treated arthritic animals. Original magnifications, ×100. This figure is representative of at least three experiments performed on different experimental days.