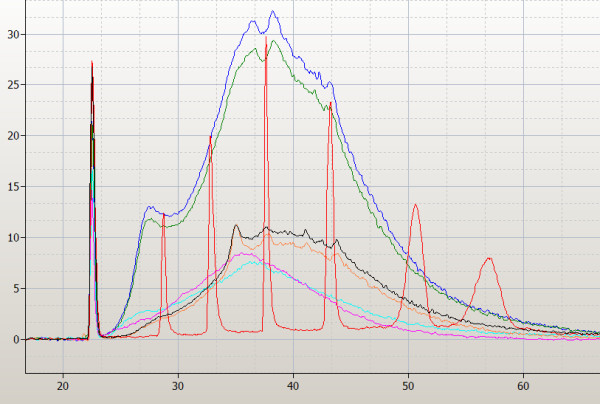
Figure 1.

Overlaid electropherograms from the analysis of unfragmented biotinylated cRNA products from the IVT reactions of the 3 different labeling kits by the Agilent 2100 Bioanalyzer. The replicate reactions from donor A are shown for each kit: One-Cycle data represented as blue and green line; BioArray as black and orange and Superscript by the pink and turquoise lines. 1 μl of the final volume (One-Cycle = 21 μl; BioArray = 60 μl; Superscript = 100 μl) of purified IVT reaction is loaded. The RNA ladder (peaks represented in red) contains a mixture of RNAs of known concentration and size (50 (lower marker) 200, 500, 1,000, 2,000, 4,000, and 6,000 bases from left to right).
