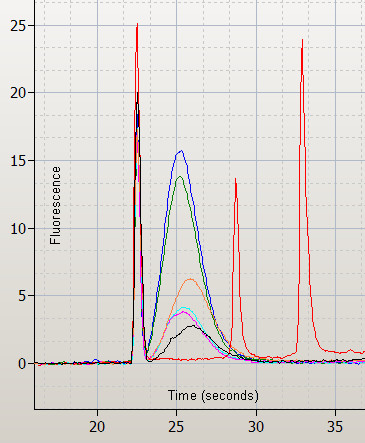
Figure 2.

Overlaid Bioanalyzer electropherograms for fragmented labeled cRNA targets showing the size distribution of fragmented target. One-Cycle replicates (blue and green); Superscript replicates (orange and black); BioArray replicates (pink and turquoise). RNA ladder in red showing the lower alignment marker and the 200 and 500 base markers.
