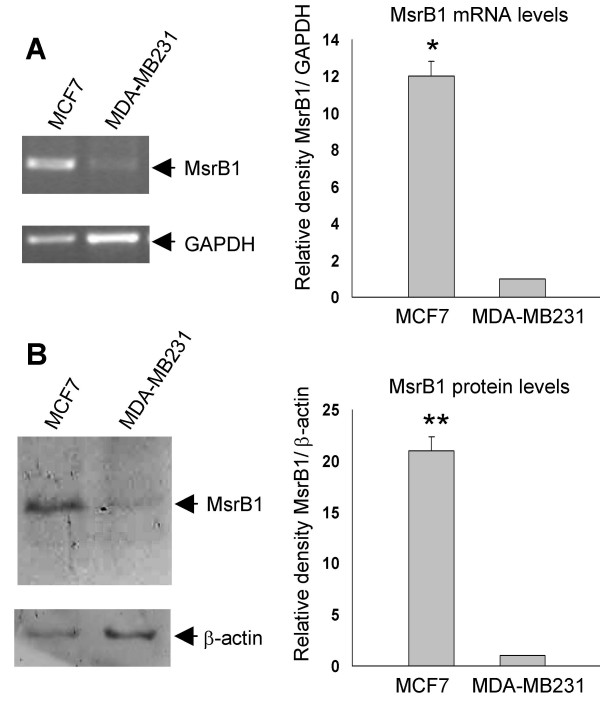
Figure 1.
Analysis of MsrB1 transcript and protein levels in MCF7 and MDA-MB231 breast cancer cell lines. (A) Ethidium bromide-stained gel showing the level of MsrB1 transcript between MCF7 and MDA-MB231 cells. GAPDH was used as the control. The MsrB1 transcript levels in MCF7 and MDA-MB231 cells were analysed using Chemi Doc System (Bio-Rad) and normalized by GAPDH signal intensities of the corresponding lanes. The data are reported as mean ± S.D. of three independent experiments; * P < 0.001. (B) Immunoblotting of MCF7 and MDA-MB231 extracts with a mouse monoclonal anti-MsrB1. The MsrB1 protein (13 kDa) levels in MCF7 and MDA-MB231 cells were analysed using Chemi Doc System (Bio-Rad) and normalized by β-actin (42 kDa) signal intensities of the corresponding lanes. Values are reported as mean ± S.D. of at least five different immunoblotting experiments; ** P < 0.005.

