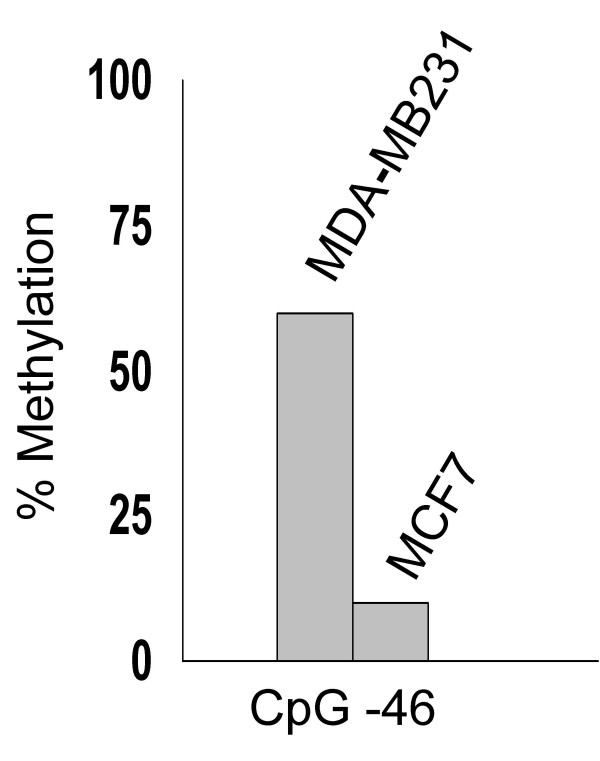
Figure 8.
Analysis of MsrB1 CpG island promoter methylation status in MCF7 and MDA-MB231 cells. Shown are results of bisulfite genomic sequencing of 20 individual clones. The x axis of the graph indicates the CpG doublet position in the 5'-flanking region of MsrB1 with respect to the start site of transcription; the y axis indicates the percentage of the subclones that were methylated.

