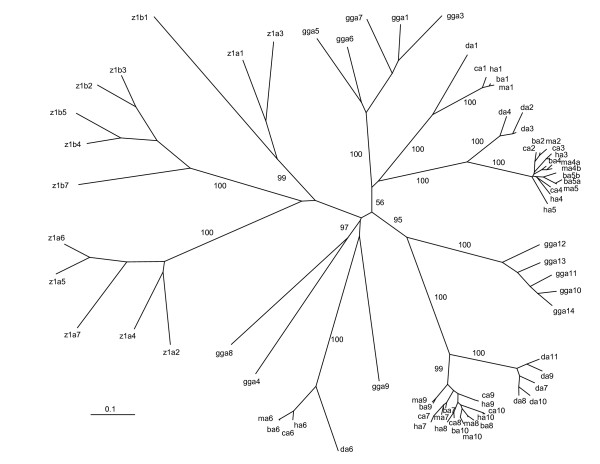
Figure 2.

Phylogenetic tree of human (h), chimpanzee (c), rhesus monkey (m), baboon (b), dog (d), chicken (Gallus gallus [gg]), and zebrafish (z) Ugt1 clusters. The major tree branches are labeled with the percentage support (only when >50%) for that partition based on 1,000 bootstrap replicates. The scale bar equals a distance of 0.1.
