
Figure 3.
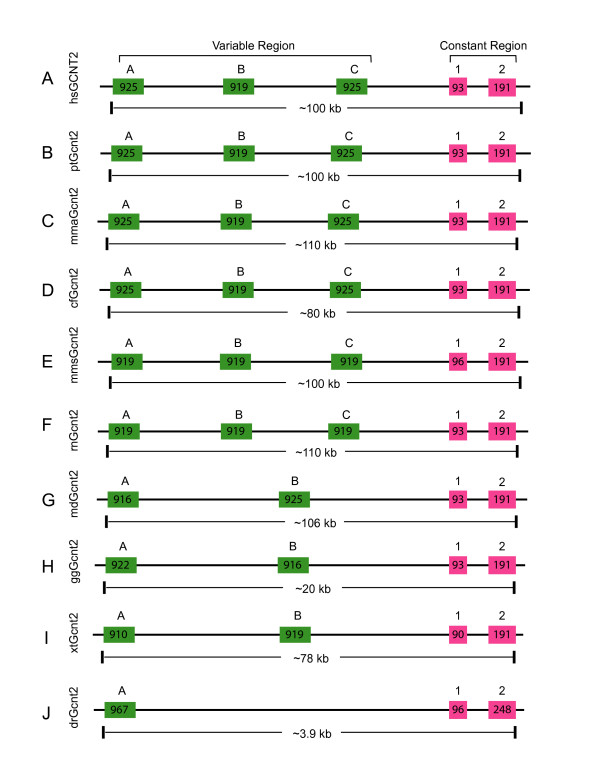
Comparison of the (A) human (Homo sapiens [hs]), (B) chimpanzee (Pan troglodydes [pt]), (C) rhesus monkey (Macaca mulatta [mma]), (D) dog (Canis familiaris [cf]), (E) mouse (Mus musculus [mms]), (F) rat (Rattus norvegicus [rn]), (G) opossum (Monodelphis domestica [md]), (H) chicken (Gallus gallus [gg]), (I) frog (Xenopus tropicalis [xt]), and (J) zebrafish (Danio rerio [dr]) Gcnt2 clusters. Each cluster contains multiple-variable and highly-similar first exons (green boxes) arrayed in tandem and a common set of two downstream constant exons (red boxes). Exon length is indicated within each box. The approximate length of each cluster is shown below the corresponding panels.