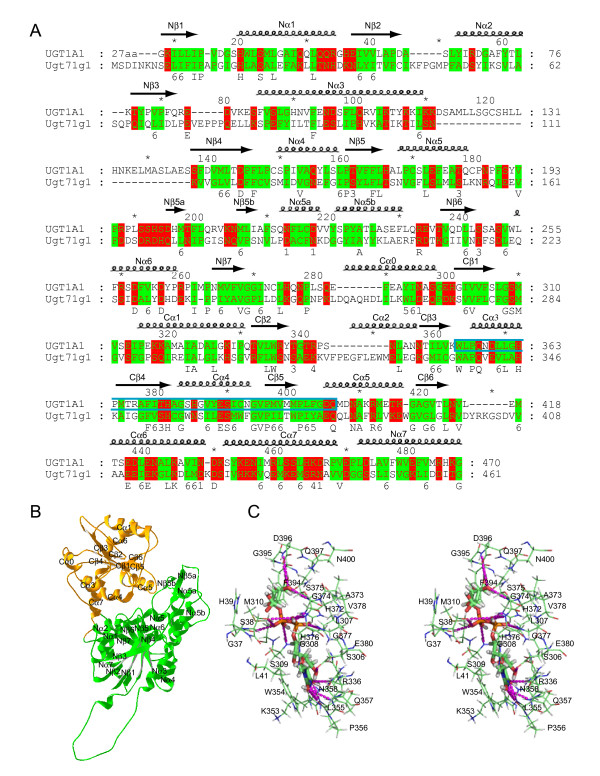
Figure 4.

Modeling of the human UGT1A1 protein. (A) Structural alignment of the human UGT1A1 polypeptide with that of UGT71G1. The secondary structure elements are shown above the alignment. The 44-aa donor signature motif of UGT1A1 is enclosed by a cyan box. Broadly conserved hydrophilic and hydrophobic residues are highlighted with degree of conservation shown below the alignment. This panel was produced by the GeneDoc program [82]. (B) Ribbon diagram of the modeled 3D structure of the human UGT1A1. The N- and C-terminal domains are shown in green and orange, respectively. The α helices and β strands in the N- and C-terminal domains are labeled. This panel was made by Swiss-PdbViewer [78]. (C) Stereo diagram showing predicted interactions between the donor UDPGA and the UGT1A1 side chains. Hydrogen bonds are indicated by dashed lines. Figures 4C, 6B, 6C, and 8 were prepared with the Pymol [83].
