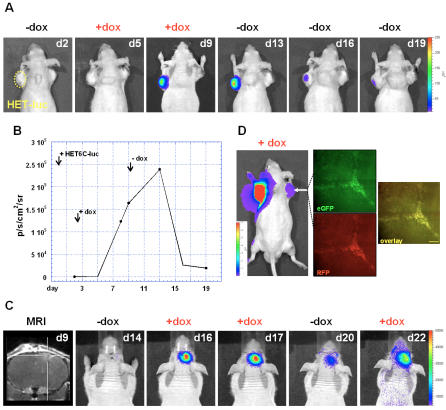
Figure 4. In vivo bioluminescence imaging of doxycycline-dependent gene expression over time.
Bioluminescence imaging of induced LUC expression and image validation by histology. Unit for all color scales as well as the histogram on temporal analysis was defined as photons/second/cm2/steradian (p/s/cm2/sr). (A) Temporal analysis of up- and down-regulation of LUC expression. HET-6C injection was performed intratumorally at day 0. Days where bioluminescent images were obtained are indicated at the upper right corner, days of doxycycline treatment at the top. (B) Quantitative analysis of luciferase signal (OFF-ON-OFF) in response to doxycycline. (C) Temporal analysis of up- and down-regulation of LUC expression in the intracranial glioma model (OFF-ON-OFF-ON). Indicated are the days of tumor growth. (D) Image validation by histology. BLI of a mouse bearing a subcutaneous glioma stably expressing LUC on its left shoulder after in vivo transduction with HET6C-luc in the tumor on the right shoulder. Representative histological sections taken from the in vivo transduced tumor showing co-localization of eGFP, expressed constitutively from the herpes viral immediate early 4/5 promoter (Figure 1), and RFP, expressed from the bi-directional regulated promoter (Scale bar overlay: 150 µm, exposure time: 0.5 s).

