
Figure 1.
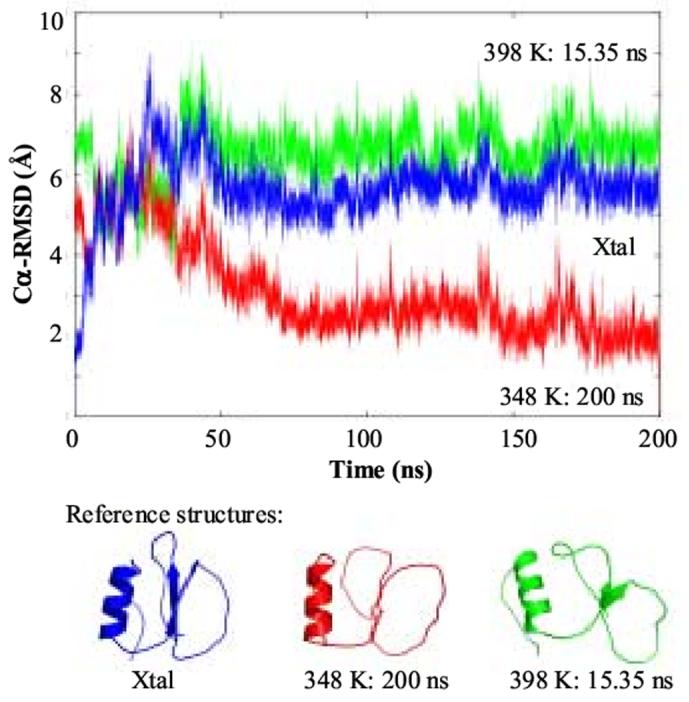
Cα-RMSD of the MD structures during the 348 K simulation relative to different reference states. The reference structures used: crystal structure33 (blue), the 200 ns 348 K N’ structure (red), and a partially unfolded 398 K MD structure (green). The reference structures are given below the plot.