
Figure 2.
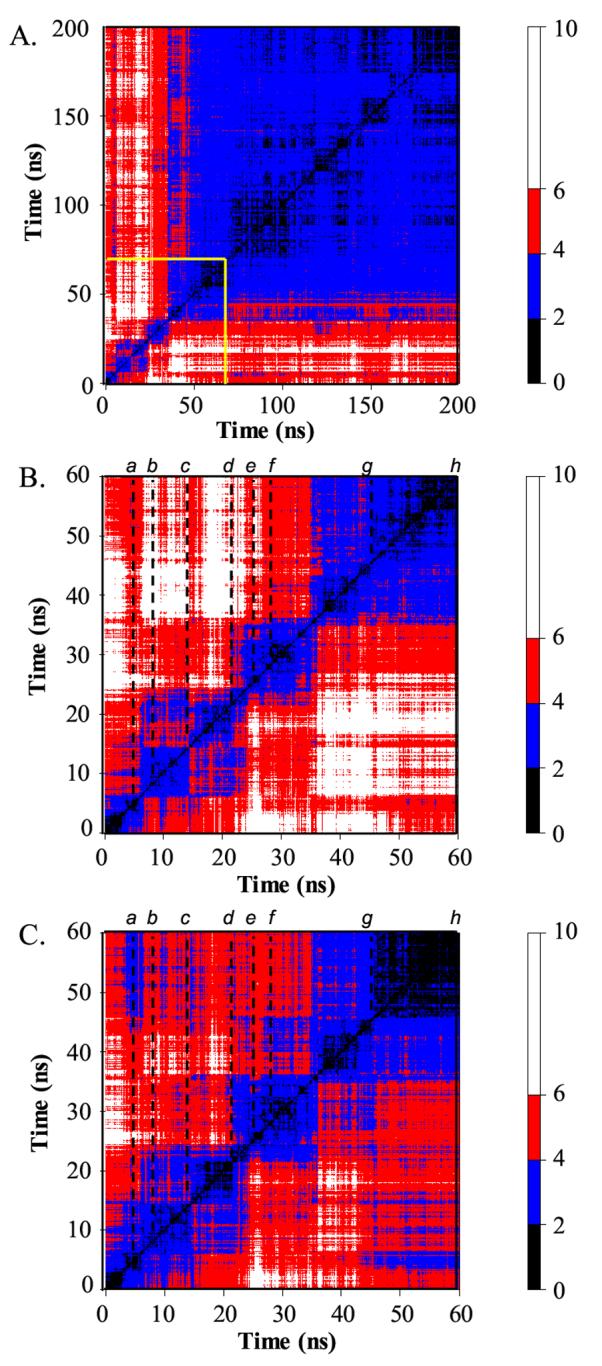
All vs. all Cα-RMSD matrices between structures along the 348 K trajectory. (A) Cα-RMSD matrix for the full 200 ns. Structures are compared every 100 ps. (B) Cα-RMSD matrix for the first 60 ns, blocked out in yellow in panel A. Structures are compared every 20 ps. The dotted lines indicate the times of representative structures given in Figure 4. (C) As B, but residues in the N- and C-termini (residues 1-12 and 53-64) are not included in the Cα-RMSD calculation. The color of a point gives the Cα-RMSD between the two time points given on the X and Y axes according to the scale on the right. Regions of black to blue along the diagonal indicate clusters of highly similar structures. Actual conformational states were determined using 3-dimensional projections with higher granularity of time points.