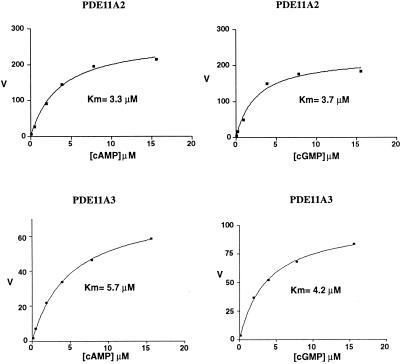
Figure 2.
PDE11A2 and PDE11A3 kinetics. PDEs were expressed in Sf-9 cells and activities measured in extracts as described in Materials and Methods. The concentration range of cAMP/cGMP is indicated on the x axis (μM). On the y axis, the velocity (V) of cAMP/cGMP hydrolysis was plotted (pmol/min/ml). Km values were determined by nonlinear regression fits of a single site binding site model using the graphpad prism program.

