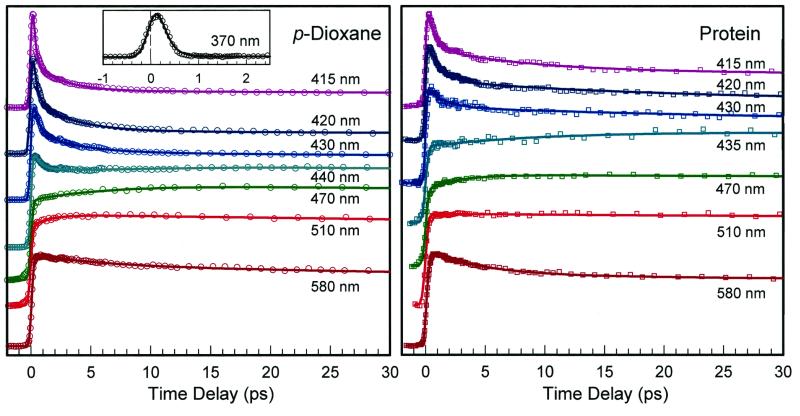
Figure 4.
The normalized fluorescence transients for a systematic series of wavelength detections. Similar patterns were observed for dm-β-CD and for the micelle. The actual intensities at 420 and 580 nm are about ≈15% and ≈30% of that at 470 nm, respectively. Note the difference in time decays for p-dioxane and the protein at the short wavelengths shown (415–430 nm) and the similarity for both at longer wavelengths (470–580 nm); see text.

