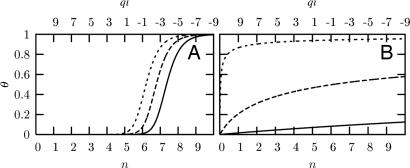
Fig. 2.
Fraction of bound ligand θ as a function of the net charge (ql) and the number of phosphorylations (n) on the ligand. (A) Variation of θ for different ligand concentrations in the mean-field model with Eb = −10 kBT, qr = 3, ql0 = 11 and 〈r〉 = 12 Å. Ligand concentrations, ρl, equal [in units of (δV)−1] 10−6 (short-dashed line), 10−7 (long-dashed line), and 10−8 (solid line). (B) Variation of θ for different numbers of binding motifs, n, for an alternate model in which Kd = (nδV)−1 exp(Eb/kBT), with Eb values −12 (solid line), −15 (long-dashed line), and −20 (short-dashed line) kBT, and ρl = 10−7 (δV)−1. The parameters n and ql are shown as continuous variables; however, only integer numbers of n and the corresponding values of ql are of physical interest. Numerical results presented in this and subsequent plots are for γ = 1, as discussed in the text, and T = 298 K.

