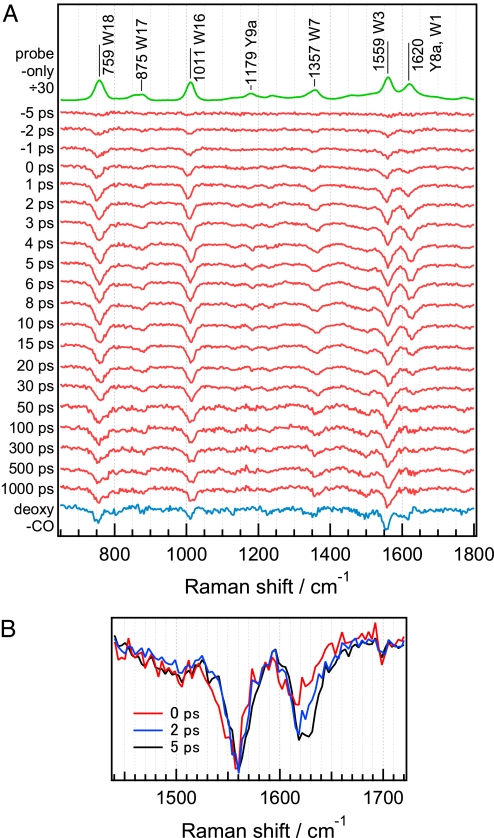
Fig. 2.
Picosecond UVRR difference spectra of the photodissociated WT horse skeletal MbCO. (A) The difference spectra in the range of 650–1,800 cm−1. The top trace is a probe-only spectrum corresponding to the UVRR spectrum of MbCO divided by a factor of 30. The bottom trace is a deoxyMb-minus-MbCO difference spectrum. Spectra have been offset for clarity. (B) The overlaid difference spectra at early time delays showing slower intensity decrease of the 1,620-cm−1 band relative to that of W3 band. The spectrum for each time delay is normalized in terms of intensity of the W3 negative band.

