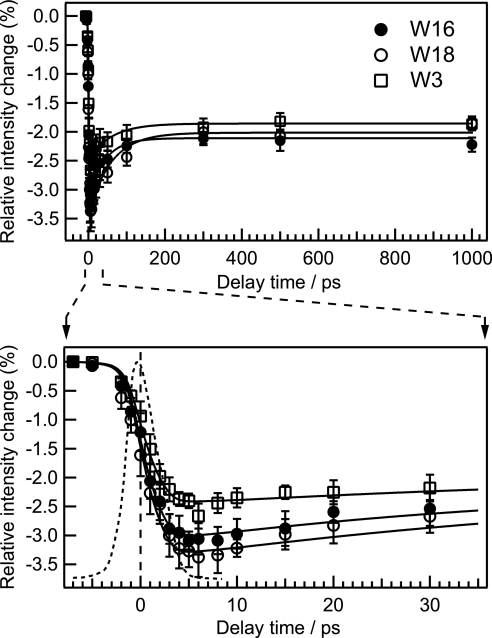
Fig. 3.
Temporal changes of integrated intensity of W18, W16, and W3 bands relative to the integrated intensity in the probe-only spectrum. The solid lines are fits using an exponential function of the form A[1 + B exp(−t/τrise)] convoluted with an instrument response function (dashed line). The fit line for each band was obtained with the parameters of τrise = 49 ± 16 ps and B = 0.62 ± 0.06 for W18, τrise = 45 ± 15 ps and B = 0.48 ± 0.05 for W16, and τrise = 59 ± 18 ps and B = 0.34 ± 0.03 for W3, respectively. The lower panel shows a close-up of the curve in the early time region of the upper panel.

