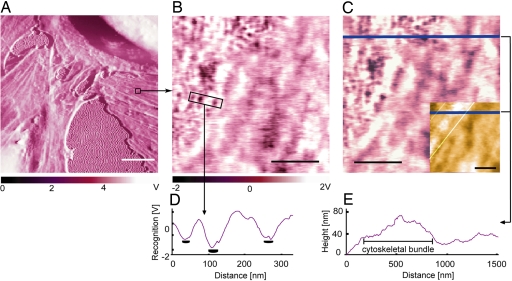
Fig. 2.
Confirmation of anti-VEGFR2 binding specificity to VEGFR2 receptors on cell surfaces. (A and B) After imaging fixed HUVECs with anti-VEGFR2-functionalized probe [phase image (A) and recognition image in region of interest (B)], a soluble antibody against a different HUVEC receptor was added. (C) Thirty minutes after addition of anti-CD31 (5 μg/ml), no competitive blocking of recognition events was observed, indicating that recognition events are specific between the cell VEGFR2 and probe-bound anti-VEGFR2. (Inset) Corresponding height image indicates the position of cytoskeletal bundles beneath the cell membrane; as in Fig. 1, bundle edges (white lines) were constructed from height traces such as E. (D) Output voltage scale for B and C shows recognition signal compared with background in a line scan over a region including three binding events (receptors). B–E show that receptors are nonuniformly distributed near cytoskeletal bundles beneath the plasma membrane. (Scale bars: 10 μm, white; 500 nm, black.) Scan rates: 10 μm/sec, A; 1 μm/sec, B and C.

