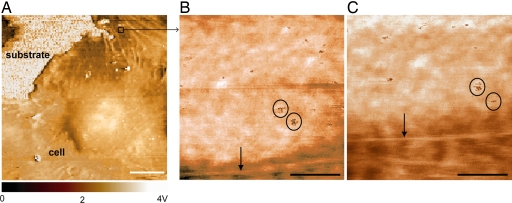
Fig. 5.
Receptor imaging on living HUVEC surface. (A) Portion of living cell imaged with anti-VEGFR2-functionalized probe in magnetic AC mode at 27°C, phase image. (B and C) Ligand–receptor binding results in punctate image contrast (circled regions are subset of observed receptors) in phase lag images that is competitively inhibited with soluble anti-VEGFR2 antibody (data not shown). Time lapse between B and C is 30 min. Note mechanical contrast and displacement of underlying cytoskeletal actin (normal to arrow) over this time scale. These images indicate 1.32 ± 0.44 × 10⁵ receptors per cell (n = 6). Scan rates: 10 μm/sec, A; 1 μm/sec, B and C. (Scale bars: 10 μm, A; 500 nm, B and C.)

