
Figure 6.
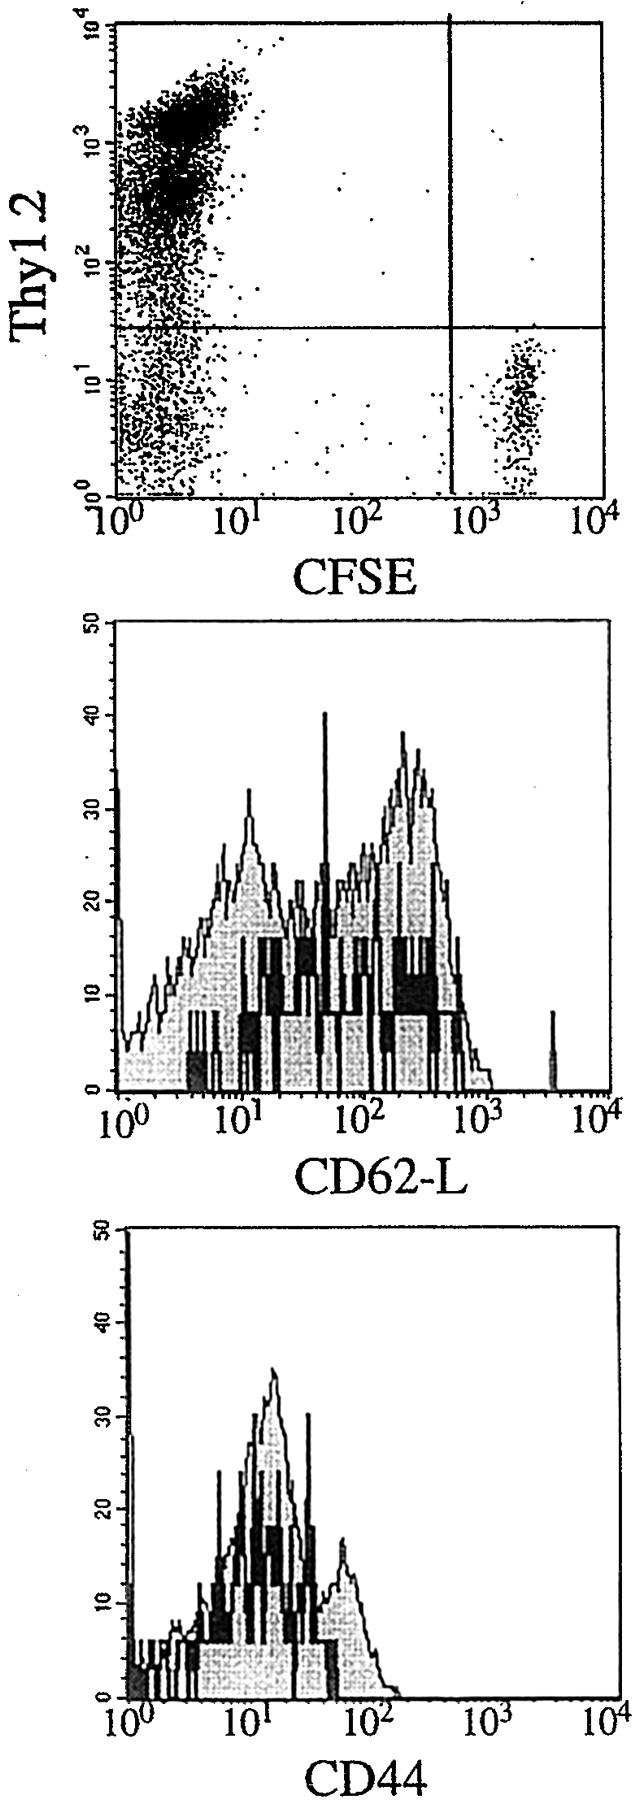
Three-color FACS® analysis of cells from draining lymph nodes (pooled from two mice vaccinated with 5.4 20 d before i.v. injection with 106 CFSE-labeled naive Thy1.1 A18 TCRtg T cells). 7 d after injection of naive T cells, lymph node cells were analyzed by FACS® for expression of CFSE, Thy1.2, Thy1.1, and activation markers. The dot plot shows CFSE levels on Thy1.2 negative (Thy1.1 positive) injected T cells. Histograms for the activation markers CD44 and CD62-l show cells gated for expression of Thy1.1 (black lines) or Thy1.2 (endogenous T cells; shaded histograms).