Figure 3.
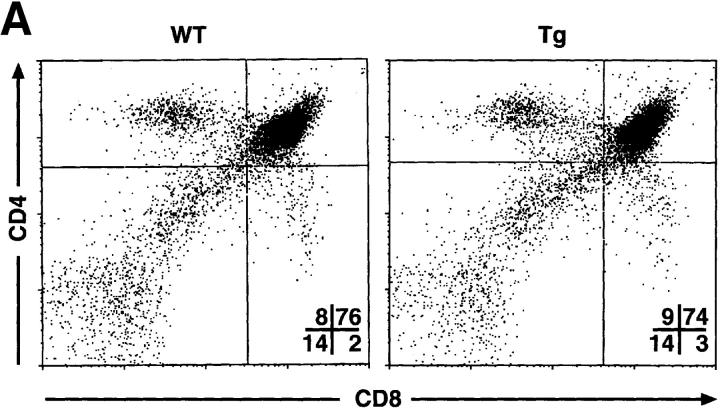
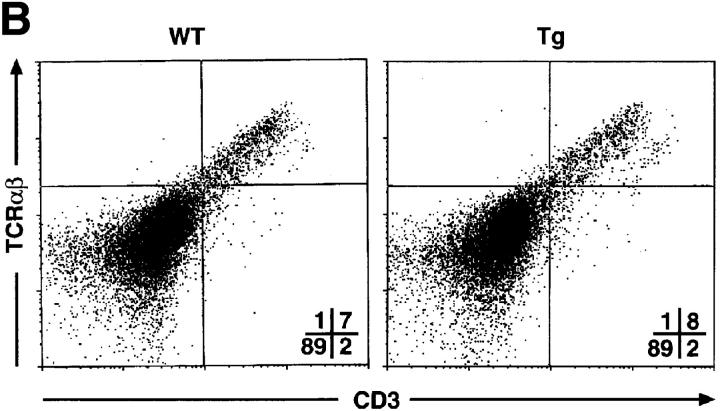
T cell development in mIκB-α transgenic mice. Single cell suspensions of thymocytes from mIκB-α transgenic (Tg) and wild-type (WT) mice were stained with PE–α-CD4 and FITC–α-CD8 (A), or PE–α-TCR-α/β and FITC–α-CD3 (B) antibodies and analyzed by flow cytometry. Percentages of cells in the individual subpopulations are shown in the lower right quadrant. (C) Splenocytes from mIκB-α transgenic (Tg) and wild-type (WT) mice were stained with 7-amino actinomycin D, PE–α-CD4, and FITC–α-CD8, and were analyzed by flow cytometry. Total numbers (× 106 cells) of live CD4+ and CD8+ splenic T cells were determined from at least three mice in each group. The data is shown as mean ± SD.


