Figure 10.

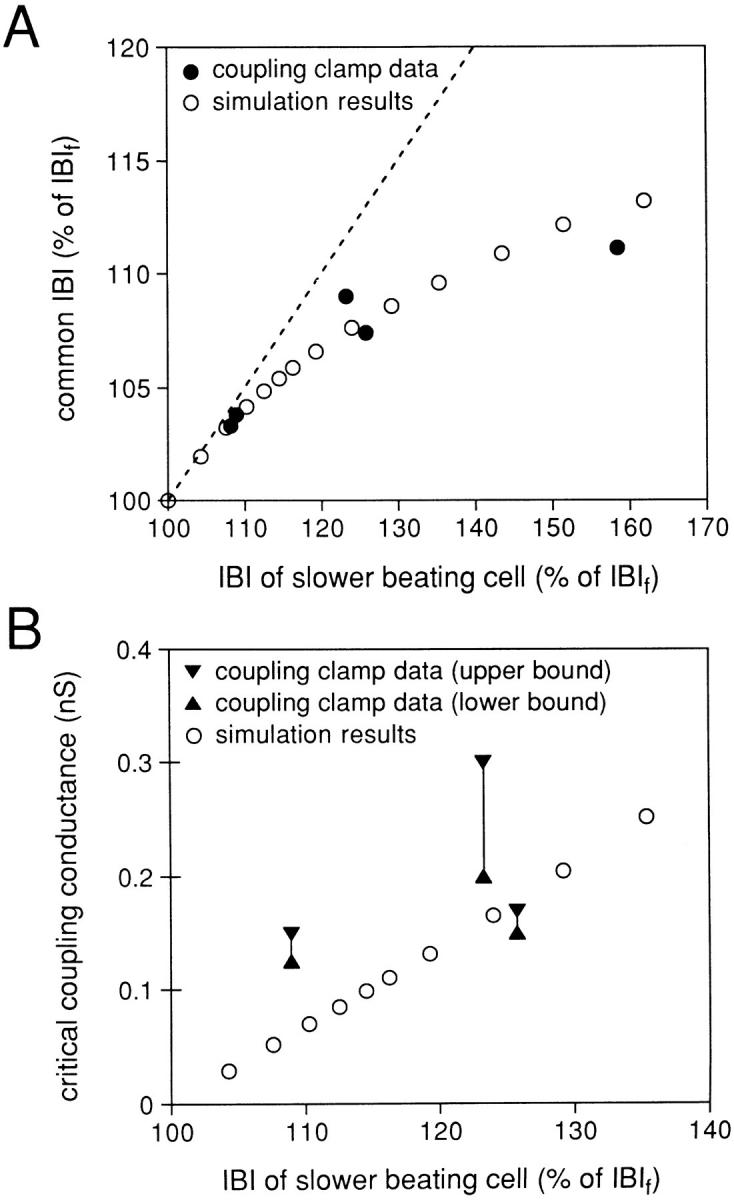
(A) Common interbeat interval (IBI) at a coupling conductance of 10 nS plotted (as a percentage of the IBI of the intrinsically faster beating cell, IBIf) versus the IBI of the slower beating cell of the cell pair (also as a percentage of the IBIf). Experimental results for the five cell pairs studied (•) and results obtained from a simulation of two pacing cells under the same conditions (○; see text). (B) Critical coupling conductance plotted versus the IBI of the slower beating cell of the cell pair (as a percentage of the IBIf). Ranges experimentally obtained for three cell pairs (solid symbols and lines) and results obtained from a simulation of two pacing cells under the same conditions (○; see text). Note the difference in abscissa scales between A and B.
