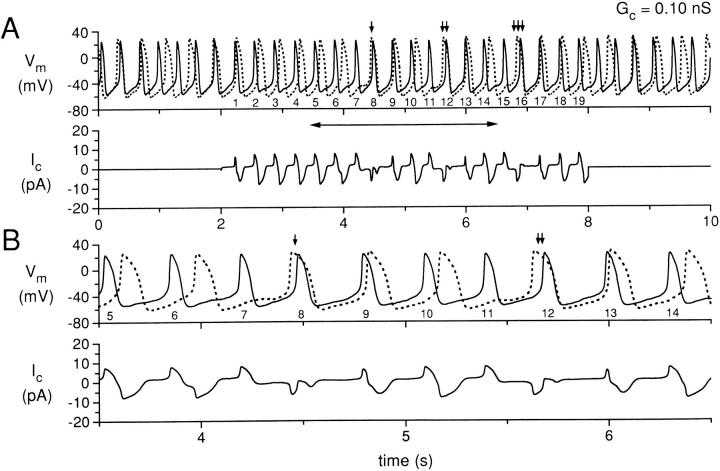
Figure 2.
Simultaneous recording for 10 s of two isolated sinoatrial node cells, with the cells uncoupled during the first and last 2 s and coupled with a coupling conductance of 0.10 nS during the central 6 s. (A) Membrane potential (Vm) of cell A (solid line) and cell B (dotted line), and coupling current (Ic). The action potentials of cell A during the coupling period are numbered 1–19 for reference. The small vertical arrows indicate action potentials for which the action potential of cell B occurs before the corresponding action potential of cell A. (B) Data in A replotted for the time period indicated by the horizontal two headed arrow in A. Data from experiment 950803-2 (see Tables).

