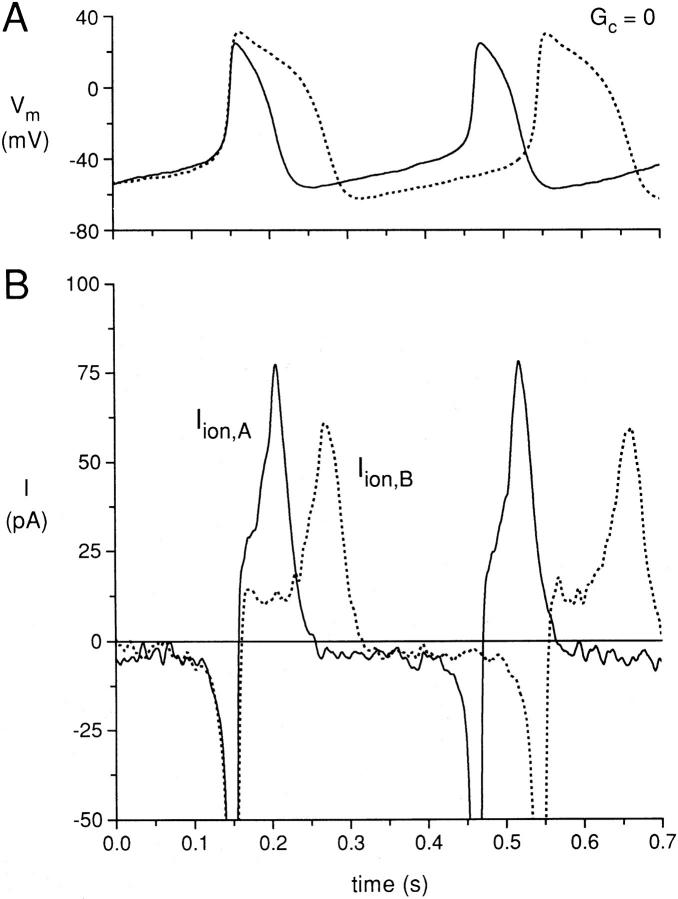
Figure 8.
(A) Superimposed action potentials for the same cell pair used for Figs. 2–7 at zero coupling conductance, with the upstrokes of the first action potentials shown for each cell superimposed in time. (B) Calculated ionic membrane currents of cell A (Iion,A; solid line) and cell B (Iion,B; dotted line).

