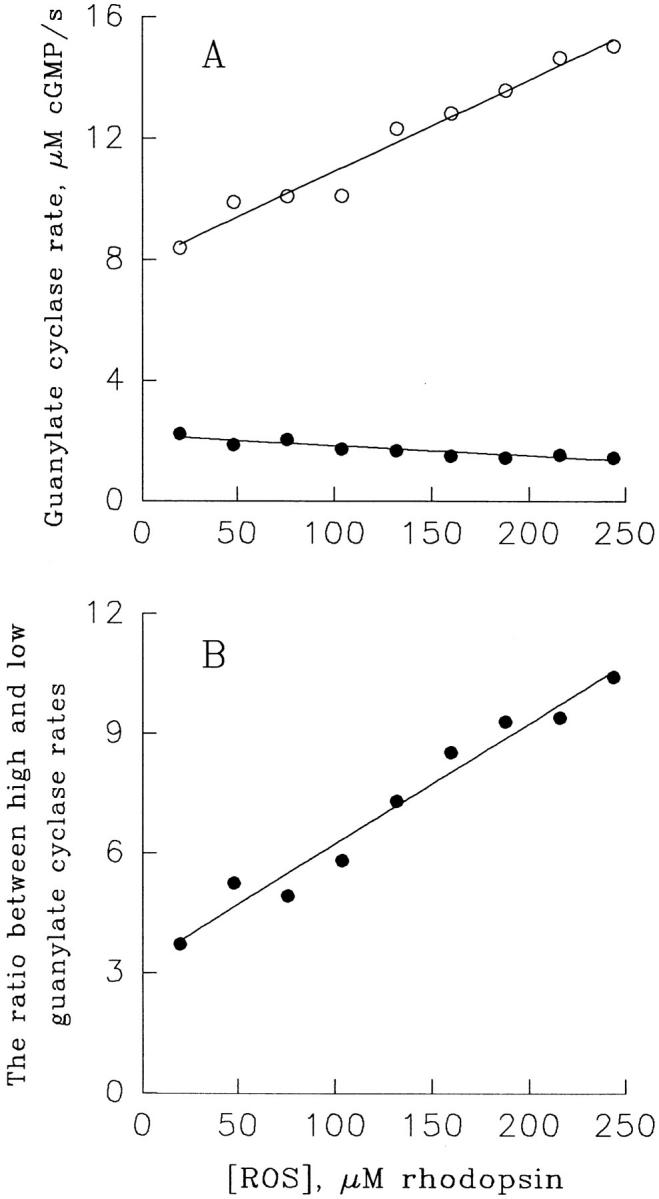
Figure 2.

The extent of Ca2+-dependent regulation of guanylate cyclase activity in frog ROS increases with the increase in ROS concentration. (A) The cyclase activity in ROS suspensions containing indicated amounts of rhodopsin was measured at 13 nM (○) and 13 μM (•) Ca2+ as described for Fig. 1, except that 1 mM GTP was used and the incubation time was 20 s. The lines represent linear regression drawn through the points. (B) The ratios of values obtained in A for low and high Ca2+ are plotted as a function of ROS concentration. The line is a linear regression drawn through the points. All data are taken from one of three identical experiments.
