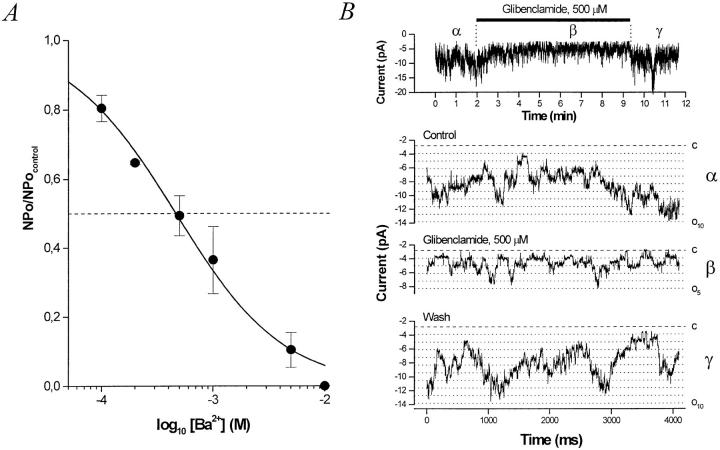
Figure 7.
Inhibitors of the BLM K+ channel. (A) Dose– response curve for inhibition of the BLM K+ channel by external Ba2+. Relative nP o (nP o/nP o,control) determined from outside-out patches at a command potential of −40 mV with KCl in the pipette and bath (solution d) is plotted versus [Ba2+]. The data at −40 mV were fitted with the Hill equation (solid curve), yielding a K i = 460 μM and n H = 0.90. The inhibition by Ba2+ is fully reversible. (B) Glibenclamide inhibits the BLM KATP channel. (top) A running average (window width 16 ms) of current versus time. Glibenclamide (500 μM) is added to the bath where indicated. (bottom) Sample traces from a representative experiment at −60 mV with KCl in the pipette and bath (solution d). Exposure of this inside-out patch to 500 μM glibenclamide reversibly decreases nP o by ∼50%. The dashed line denotes the all channels closed (leak) current level and the dotted lines indicate each open channel level.

