Figure 2.

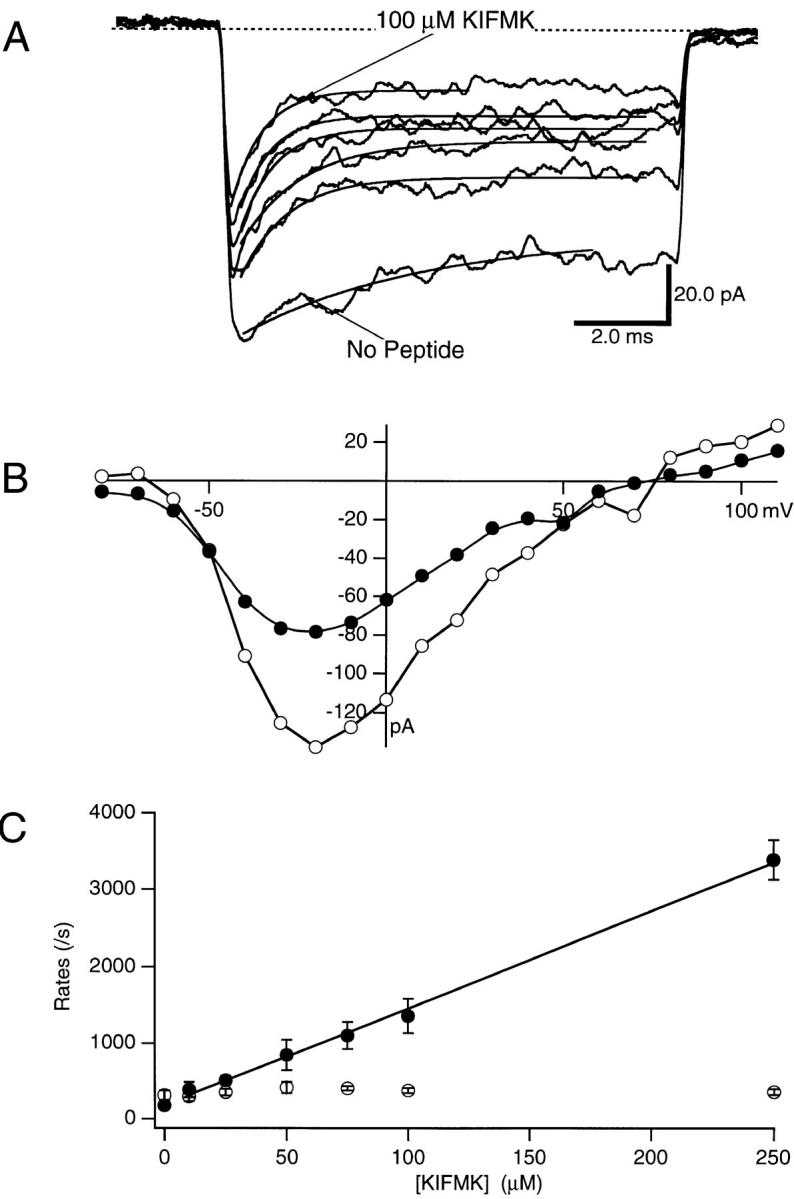
(A) Effects of intracellular KIFMK concentration on F1489Q currents. Macroscopic currents were elicited by voltage steps from −100 to 0 mV, while a solution of KIFMK was applied to the cytoplasmic surface of the inside-out excised patch of membrane. The concentration of KIFMK peptide ranged from 10 to 250 μM. Exponential fits of Eq. 1 (see materials and methods) to determine the blocking and unblocking rates are superimposed on each current trace. (B) Current–voltage relations of F1489Q in the presence of 100 μM KIFMK compared with peptide free. Peak currents were measured for each test voltage ranging between −80 and 110 mV and plotted versus the voltage of the applied test pulse. In this patch, the data from no peptide control currents were plotted as unfilled circles (○) and data from currents in the presence of 100 μM KIFMK were plotted as filled circles (•). (C) Blocking and unblocking rates plotted as a function of KIFMK concentration. The mean blocking (•) and unblocking (○) rates of four patches determined for each concentration are shown (mean ± SEM). The smooth line is a fit to the blocking rates of the equation k b = 1.2 × 10⁷ ± 0.2 M−1s−1 *[KIFMK] + 188. The average k u was 362/s.
