
Figure 11.
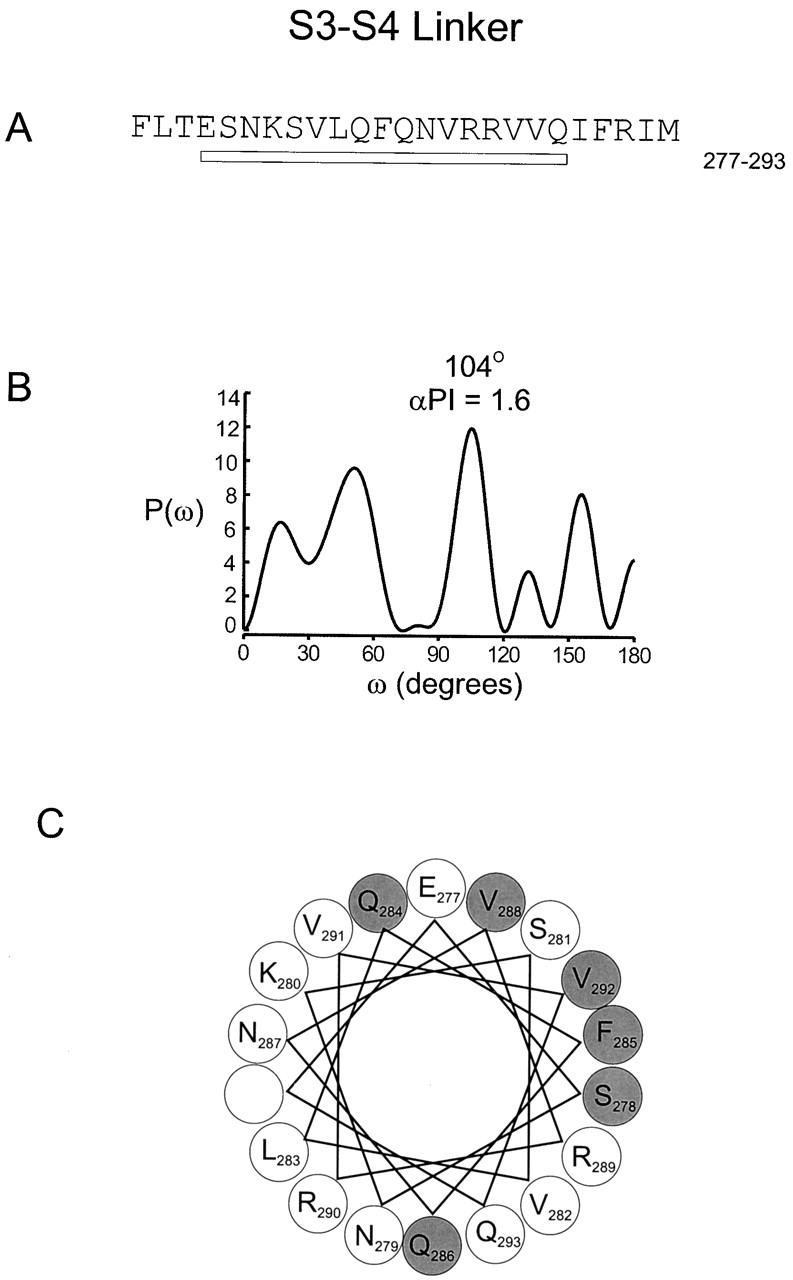
Periodicity of gating perturbations in the S3–S4 linker. (A) Amino acid sequence of the S3–S4 linker in the drk1 K+ channel. The bar indicates the stretch used for Fourier transform analysis. (B) The power spectrum of the |ΔΔG 0| values for this stretch, where P(ω) is plotted as a function of angular frequency (ω). The primary peak of power spectrum occurs at 104°. (C) Helical wheel diagram of these 17 residues viewed from the NH2 terminus. Large shaded circles indicate positions with |ΔΔG 0| > 0.5 kcal mol−1 and large open circles indicate positions with |ΔΔG 0| ≤ 0.5 kcal mol−1.