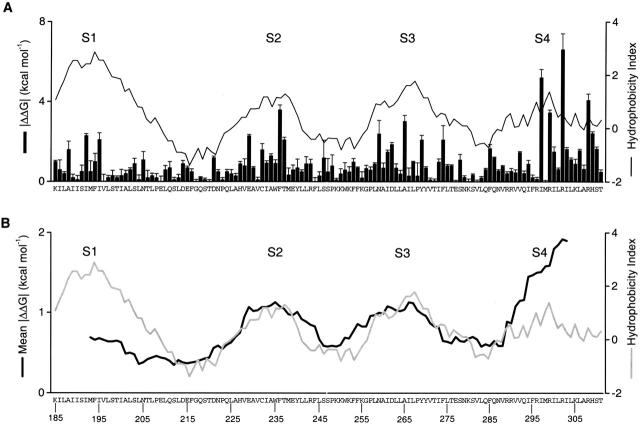
Figure 3.
Distribution of free energy perturbations in channel gating. (A) The bar graph plots the absolute value of ΔΔG 0 for all mutations studied. Data are mean ± SEM from Table . The solid line superimposed on the |ΔΔG 0| plot is a windowed hydrophobicity index calculated using the Kyte-Doolittle scale (Kyte and Doolittle 1982) with a 17-residue window. (B) Sliding window analysis for mean ΔΔG 0 (black line) and hydrophobicity index (gray line). Both use a 17-residue sliding window. Letters and numbers indicate the wild-type residues and their positions, respectively.

