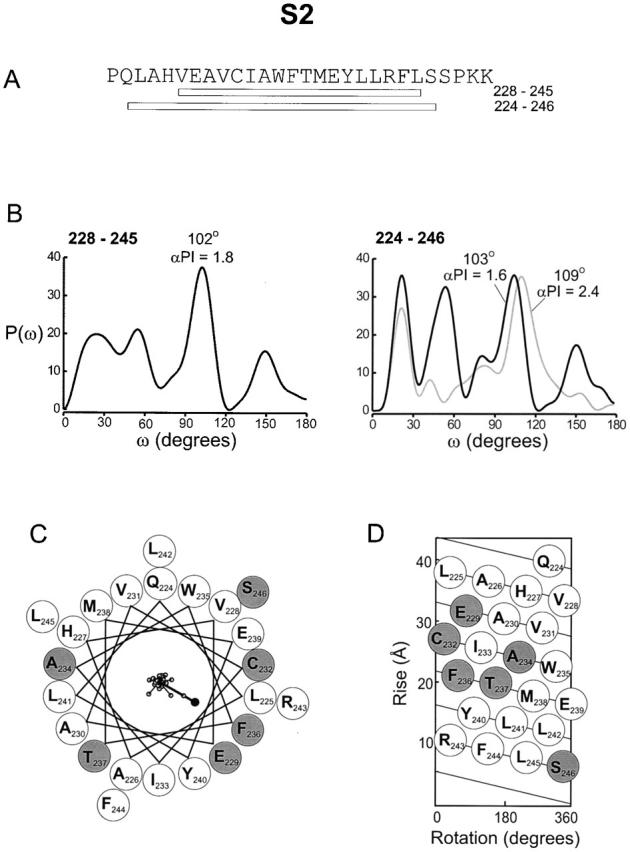
Figure 6.

Periodicity of gating perturbations in the S2 Segment. (A) Amino acid sequence of the S2 segment in the drk1 K+ channel with bars indicating the lengths used for the Fourier transform analysis. (B) Power spectra of |ΔΔG 0| values are for either 18 (left) or 23 (right) residues. The primary peak in the power spectra occurs at 102° for the short stretch and at 103° for the long sequence. Gray line in right power spectrum was calculated using data from Monks et al. 1999 for positions in Shaker K+ channel equivalent to 224–246 in the drk1 K+ channel. P(ω) for the Shaker data was scaled down by factor of 8.5 for comparison and has a dominant peak at 109°. (C) Helical wheel diagram containing 23 residues (from Q224 to S246) viewed from the extracellular side of the membrane. Large shaded circles indicate positions with |ΔΔG 0| ≥ 1 kcal mol−1 and large open circles indicate positions with |ΔΔG 0| < 1.0 kcal mol−1. |ΔΔG 0| values were plotted as vectors on the helical wheel (small open circles); scale is 0–6.9 kcal mol−1. The sum of the |ΔΔG 0| vectors, represented by the solid circle, has a magnitude of 5.3 kcal mol−1. (D) Helical net diagram for 23 residues with top as extracellular and bottom as intracellular. Open and shaded circles are as in C.
