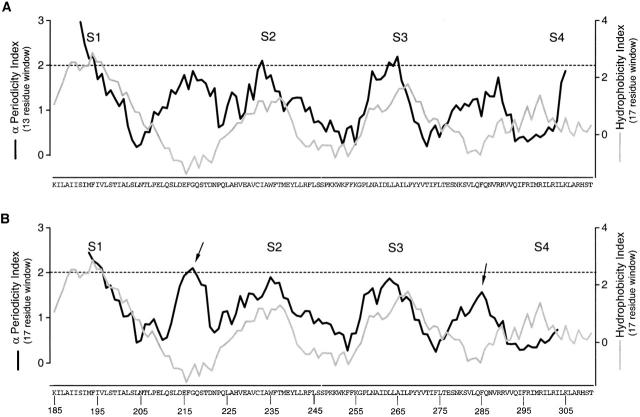
Figure 9.
Windowed α-periodicity analysis for S1–S4. (A) Windowed α-periodicity index analysis with a 13-residue sliding window (black line). (B) Windowed α-periodicity index analysis with a 17-residue sliding window (black line). The superimposed gray line in both A and B is a windowed hydrophobicity index calculated using the Kyte-Doolittle scale (Kyte and Doolittle 1982) with a 17-residue window. Dashed lines in both A and B mark α-PI = 2.0. α-PI ≥ 2.0 suggest α-helical secondary structure (Cornette et al. 1987; Rees et al. 1989b). The arrows mark positions in the S1–S2 and S3–S4 linkers with high α-PI values.

