Figure 5.
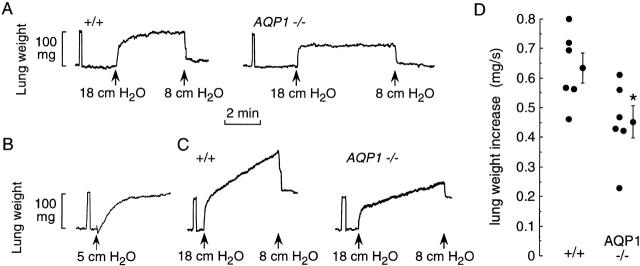
Characterization of hydrostatic lung edema. The pulmonary artery was perfused with isosmolar HBS. (A) Time course of lung weight in response to changes in perfusate pressure at zero venous outflow pressure. Initial perfusate pressure was 8 cm H2O. (B) Perfusate pressure was set at 8 cm H2O and venous outflow pressure was increased from 0 to 5 cm H2O. (C) Same as in A, except that venous outflow pressure was kept at 5 cm H2O. (D) Summary of the rate of weight accumulation (slope of linear weight increase) from individual mice studied as in C. *P < 0.05 (unpaired t test).

