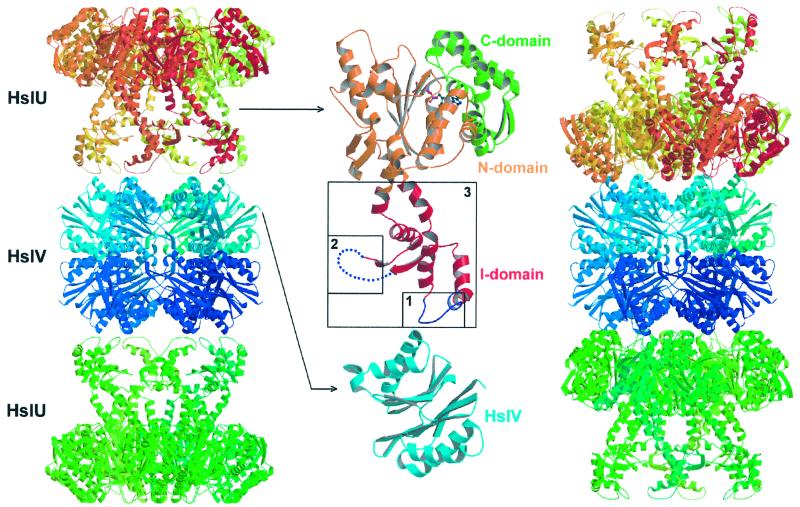
Figure 1.
Two possible docking modes of the HslVU complex and sites of deletion in the I domain of HslU. Ribbon diagram of the HslVU crystal structure (Left) and modeled complex structure based on EM images and considerations of steric complementarity (Right). Model of the disordered part in the I domain is taken from free (HslU)6-(AMP-PNP)3 structure (Protein Data Bank ID code 1DO2). Closeup view of deleted regions in the I domain (Middle). Numbers 1, 2, and 3 correspond to the Δ137–150, Δ175–209, and Δ111–239 deletion mutants, respectively. The N, C, and I domains are shown in orange, green, and red, respectively. This figure was drawn by using MOLSCRIPT (26) and rendered by using RASTER3D (27).

