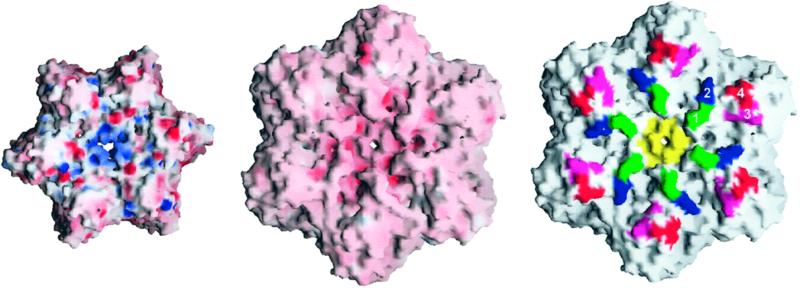
Figure 2.
Representation of the electrostatic potential surfaces of HslV (Left) and HslU (Center) involved in the EM mode of docking. Negatively charged regions are in red, and positively charged regions are in blue. Sites of mutations in the HslU (Right). Numbers 1 (green) and 3 (pink) mark sites of pentaglycine insertions after residues 264 and 387 as well as changes of surface charges (E266Q; E266Q/E385K), 2 (blue) marks the site of introduction of a bulky side chain (I312W), and 4 (red) marks the site of a charge reversal (E436K/D437K). The hexamer pore is colored in yellow. This figure was drawn by using GRASP (28).

