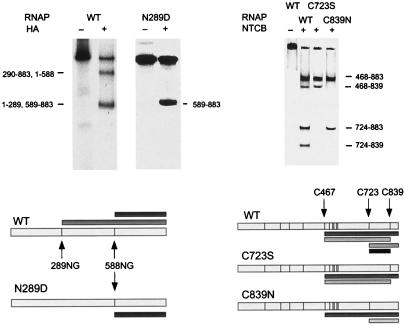
Figure 4.
Coarse mapping of the crosslink at −9. Complexes having a transcript crosslinked at −9 were formed using WT or mutant RNAPs, as indicated. Samples were digested with HA (Left) (11) or NTCB (Right) (17) and analyzed as in Fig. 3. The bars at the bottom provide a schematic representation of the fit of the observed labeled peptides to the predicted cleavage sites in the RNAP. Cleavage within the cluster of six cysteine residues from 467 to 540 is represented as a single cleavage event at C467.

