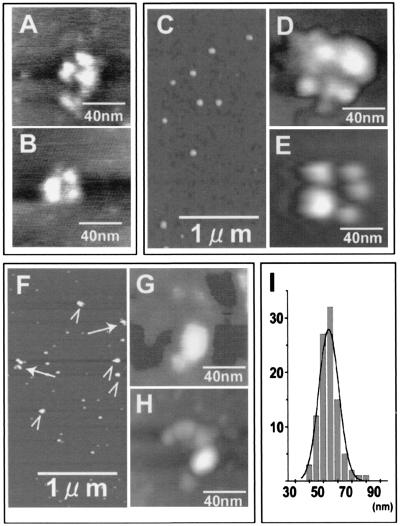
Figure 4.
AFM analyses of the subunit assembly and conformational change of RFC. AFM images of PCNA consisting of three homologous subunits (A, B), and RFC in the absence (C, D) or presence of ATP (E–H) at different magnifications. Images were obtained with regular cantilevers for C, D, F, and G, and with carbon nanotube tips for the rest, which provides a better lateral resolution. In F, arrows and arrowheads indicate open and closed forms of RFC, respectively. The frequency of finding the open forms was about 10% in more than 10 independent experiments. (I) A histogram that depicts the relationship between the frequency (ordinate) and the apparent size of closed forms without ATP measured through the cross section of the entire subunit complex (abscissa). A statistical analysis revealed that the average of the measured dimensions of the closed complex is 59.0 ± 7.0 nm (n = 98), which is reasonable considering the size of the conventional AFM tip. In the case of C form, the length of their longest cross section is 85.1 ± 1.9 nm (n = 5).

