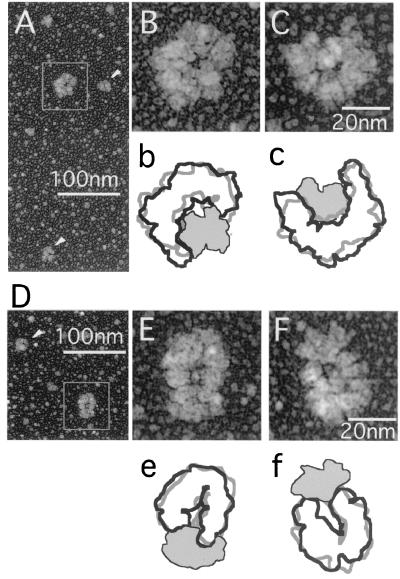
Figure 5.
TEM images of RFC-PCNA complexes. Low-power views of RFC-PCNA mixed sample in the presence (A) and absence of ATP (D). Arrowheads and boxes show images of free PCNA and RFC-PCNA complex, respectively. The standard bar length is 100 nm. Enlarged images of RFC-PCNA complexes in the presence and absence of ATP are shown in (B, C) and (E, F), respectively, with standard bars of 20 nm. The dimensions of the complexes are 37.1 ± 2.9 nm and 28.9 ± 4.9 nm at the longest and shortest axes in the presence of ATP (n = 10), and 44.2 ± 3.7 nm and 28.9 ± 3.6 nm in the absence of ATP (n = 10), respectively. The apparent difference in their ratios of axes,1.28 and 1.53, indicates the structural difference of the complex in the presence and absence of ATP. Interpreted outlines for RFC (thick lines) and PCNA (thin lines filled with shadow) are indicated below the images as b, c, e, and f. The overlapped gray lines are the outline of Fig. 3R for b and c, 3F for e, and 3H for f, respectively.

