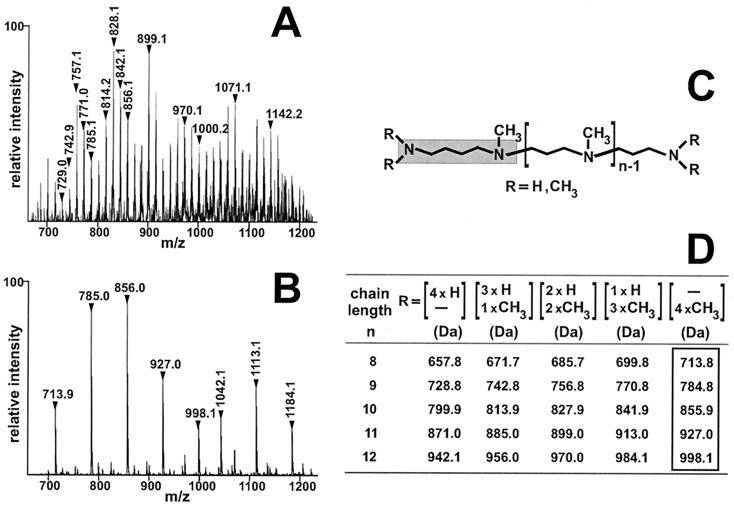
Figure 3.
Permethylation analysis of the polyamines from N. angularis. (A and B) Electrospray ionization/MS analysis of singly charged positive ions. (A) Unmodified polyamines from N. angularis. Two peak series, which are separated by 71 units, are denoted by vertical numbers that indicate the m/z value of the corresponding peak. Within each series, peak masses differ by 14 units. The horizontal numbers indicate selected molecules whose masses differ by 71 units. (B) Polyamines from N. angularis after permethylation. Two peak series can be discerned, which are denoted by horizontal numbers (putrescine basis) and vertical numbers (ornithine basis), respectively. Within each series, peak masses differ by 71 units. (C) Scheme of proposed general polyamine structure. The gray box highlights the putrescine moiety. (D) Theoretical molecular masses of putrescine-based polyamine molecules. Each line corresponds to a given polyamine chain length and lists the theoretical molecular masses of methylation isoforms. The molecular masses of fully methylated isoforms are boxed.

