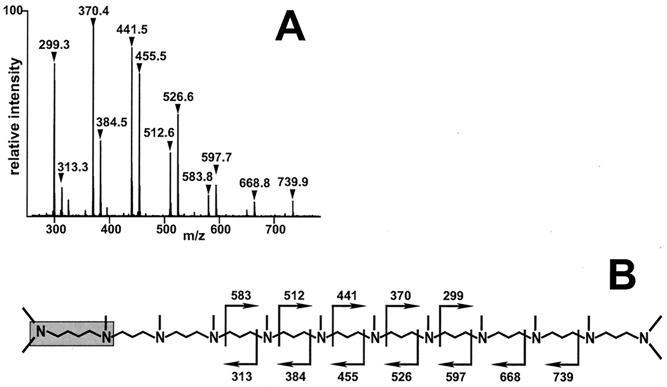
Figure 4.
Fragmentation analysis. (A) Product ion spectrum obtained by collision-induced fragmentation of the (m + H)+ = 856 ion (see mass signal in Fig. 3B). Two series of ions were detected that differ by 14 units. Within each series, neighboring peaks differ by 71 units. (B) Proposed structure (schematic) of the (m + H)+ = 856 ion. Cleavage positions that lead to the observed fragment ions are depicted by rectangular arrows, and the corresponding masses are indicated. The putrescine residue is highlighted by a gray box.

