Figure 3.
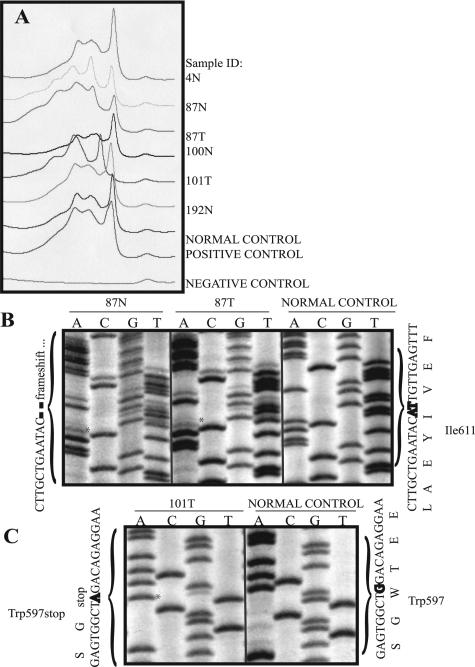
hMLH1 exon 16 d-HPLC analyses and manual sequencing results. A: Representative chromatogram showing absorption/wave patterns of cases: 4N, 87N, 87T, 100N, 101T, 192N, and controls including normal (genomic DNA from a noncancer patient), positive (genomic DNA from a colon cancer patient with known hMLH1 exon 16 mutation), and negative control (hMLH1 exon 16 sample without a DNA template). Note the variable absorption patterns seen in mutation-positive samples 87N, 87T, 101T, and positive control relative to the wave pattern in the normal control. B: hMLH1 exon 16 manual sequencing results for samples 87N/T (asterisks) and normal control. C: hMLH1 exon 16 manual sequencing results for sample 101T (asterisk) and normal control. B and C were sequenced in the forward direction. Nucleotide and amino acid sequences are shown along the margins. All mutations were also confirmed in the reverse direction (not shown). N, normal/genomic DNA sample; T, tumor DNA sample.

