
Figure 4.
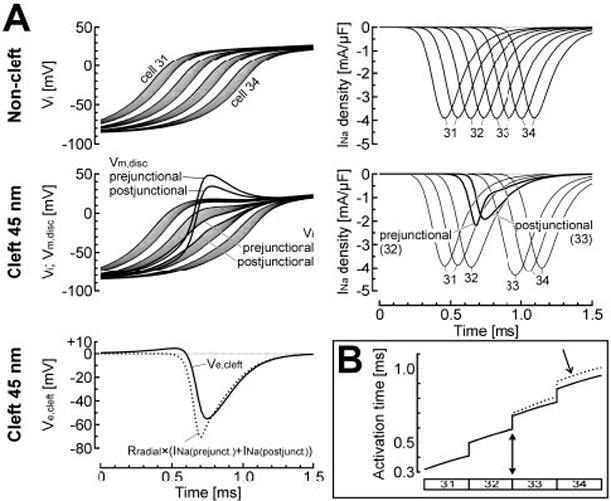
Inhibitory effects of cleft potentials on conduction, for normal gap-junctional coupling and 100% junctional INa. A, top, AP upstrokes (left) and INa density (right) in the 4 central cells (31 to 34) when the noncleft model was used for all junctions. Middle and bottom left, Same simulation, except that a 45-nm cleft was introduced at the junction between cells 32 and 33. As a result of the large negative extracellular cleft potential at this junction (Ve,cleft, solid line in bottom left panel), the transmembrane potential of the pre- and postjunctional disk membranes (middle left panel, Vm,disk) exhibited a large overshoot that led to a reduction of the driving force for INa and consequently to a large reduction of INa itself (middle right panel). The dotted curve in the bottom left panel indicates the potential that would have been induced across the radial cleft resistance by a current equal to INa (prejunctional)+INa (postjunctional). B, Activation profiles of cells 31 to 34 for the two simulations shown in panel A (solid curve: noncleft model; dotted curve: 45-nm cleft between cells 32 and 33, filled arrowhead). Note the conduction delay (arrow) resulting from the reduction of INa at the central cleft.