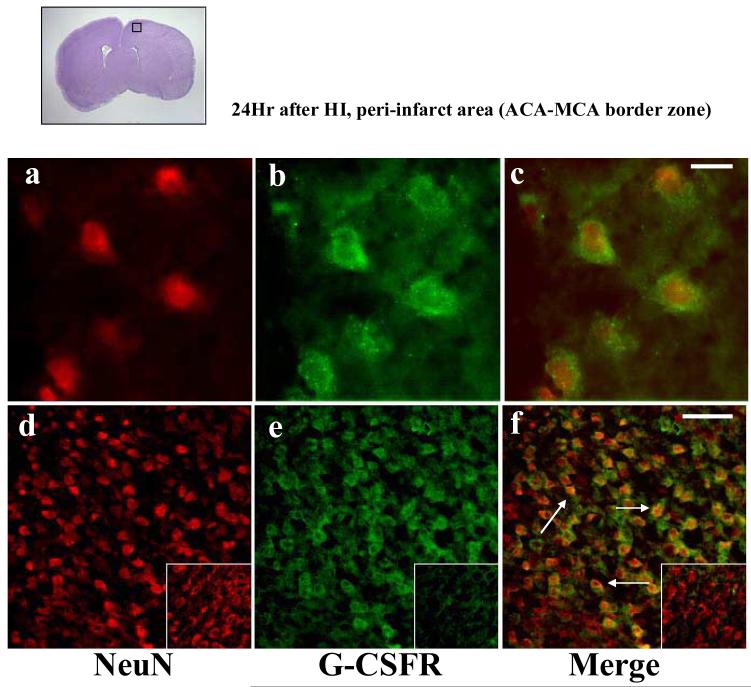
Figure 3.
G-CSF receptor (G-CSFR) is expressed in the neonatal rat brain neurons after hypoxia-ischemia. Double immunofluorescence photomicrographs (n=4) of NeuN immunoreactivites (red, neuronal marker, panels a,d), G-CSFR immunoreactivites (green, panels b,e) and their merged images (panels c,f) from brain sections taken from the peri-infarct area at 24hr after hypoxia-ischemia at high magnification (x100, Scale bar 10μm, panels a,b,c) and low magnification (x20, Scale bar 20μm, panels d,e,f). The top left picture with denotes the region of interest. The insets show respective immunoreactivities from Group C.

