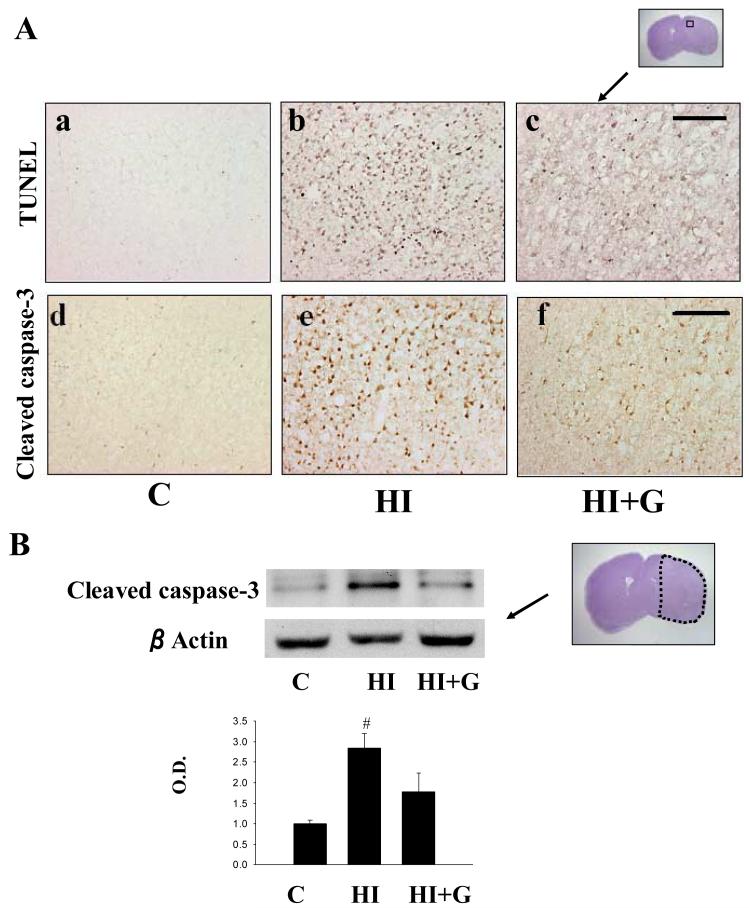
Figure 4.
Apoptotic cell death after neonatal HI. A. representative photomicrographs of TUNEL stained brain sections and cleaved caspase-3 stained sections from the peri-infarct zone demonstrate fewer markers of apoptotic cell death in group HI+G compared to group HI 24 hours after hypoxia-ischemia. Scale bar = 200μm. B. Western blot for cleaved caspase-3 protein expression demonstrates less cleaved caspase-3 in group HI+G compared to group HI 24 hours after hypoxia-ischemia. The lower panel depicts cleaved caspase-3 protein expression measured by densitometry analysis. Values represent mean ± S.D. with 5 samples in C group and 8 samples in HI, HI+G group each, expressed as percent change over control group. On ANOVA, p< 0.05 for # when compared to Group C. O.D., optical density.

