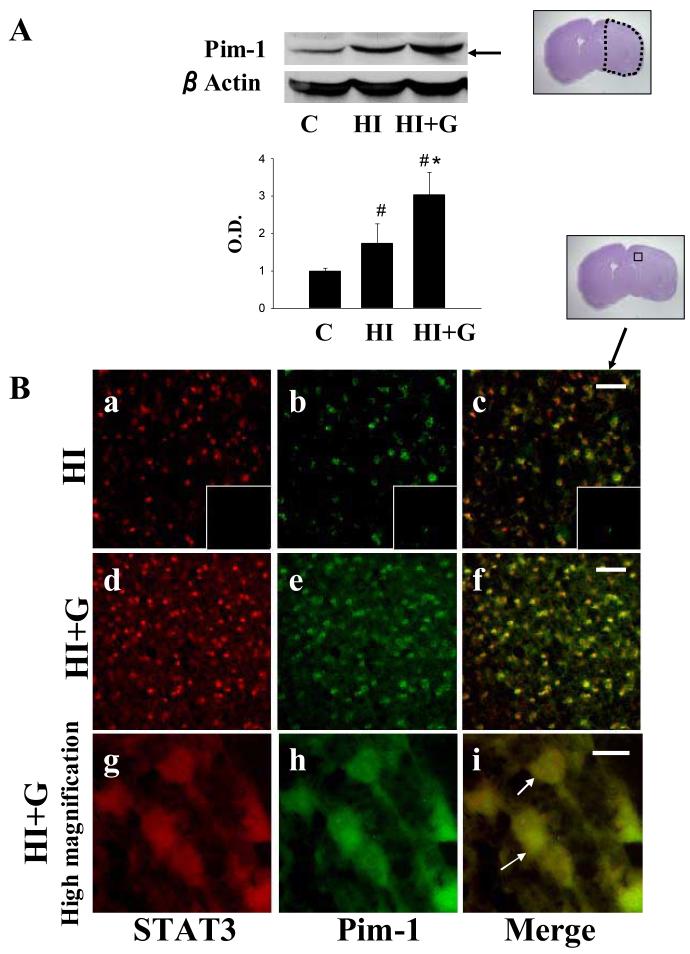
Figure 7.
A. G-CSF treatment was associated with significantly increased expression of Pim-1 on Western blot analysis 24 hours after hypoxia-ischemia. values represent mean ± S.D. with 5 samples in C group and 8 samples in HI, HI+G group each, expressed as percent change over control group. On ANOVA, p< 0.05 for both # and * when compared to Group C and HI, respectively. O.D., optical density. The Nissl stained photomicrograph depicts the area of interest. B. Double immunofluorescence for STAT3 and Pim-1 demonstrated coexpression of these two proteins 24 hours after hypoxia-ischemia, with qualitative increased expression in group HI+G. Panels a-f, low magnification ×20, Scale bar 50μm. Panels g-i, high magnification ×100, Scale bar = 10μm.

