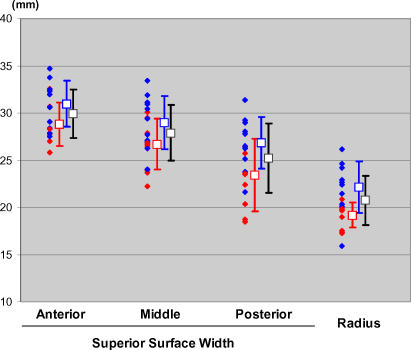
Figure 4. Talar Dome Morphometric Measures (n = 21).
Morphometric data of the talar dome in the twenty-one subjects (10 females and 11 males). For each individual subject, the three talar dome widths (at the anterior, middle, and posterior parts of the superior talar surface) and arc radius (on the mid-sagittal section) are plotted as red (female) or blue (male) filled diamonds. The neighboring unfilled squares and error bars indicate the averages and standard deviations for each gender (red or blue) and those across all subjects (black.)

