
Figure 6.
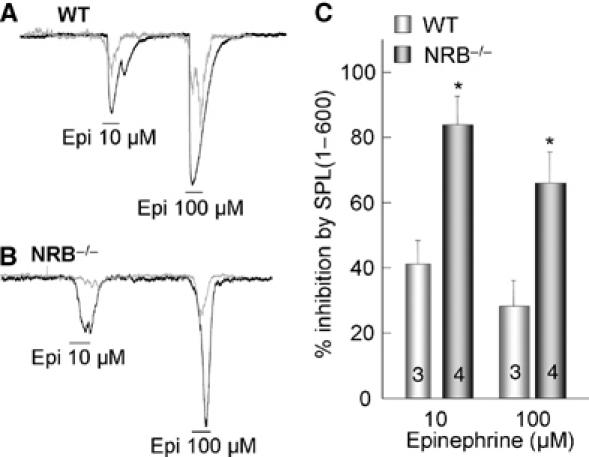
Sensitivity of Ca2+ signaling to inhibition by SPL in WT and NRB−/− cells. Parotid duct cells from WT (A) and NRB−/− mice (B) were infused with 100 nM His-SPL(1–600). The cells were stimulated with 10 and 100 μM Epi and the peak currents were used to calculate current density in terms of pA/pF and to calculate the percent inhibition. The results are summarized in (C) as the mean±s.e.m. of 3–4 experiments. *P<0.05.