
Figure 4.
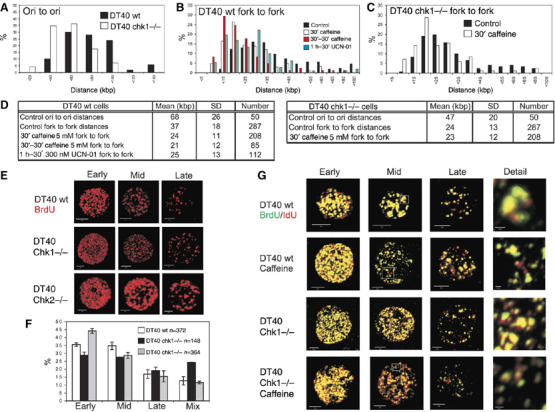
Inhibition of ATR or Chk1 mimics the replication phenotype of Chk1-deleted DT40. Active replicons in Chk1−/− and isogenically matched wt DT40 cells were analysed after pulse labelling with biotin-11-dUTP. Replication structures were visualised on spread DNA fibres as in Figure 1. Changes in replicon structure in cells with compromised Chk1 activity are shown (frequency histograms (A–C)). In wt DT40, caffeine and UCN-01 (panel B) produced a significant decrease in replicon size (P<1.197E-21 and 2.52E-12, respectively, versus controls). No difference was seen when Chk1−/− DT40 cultures (panel C) were treated with caffeine (P=0.541). Parameters defining average replicon structure under different conditions are shown (D). The S-phase programme of wt DT40 was also compared with Chk1- and Chk2-deficient cells. Cells were pulse labelled for 20 min with BrdU, immunolabelled (E) and the proportion (F) of early-, mid- and late-S-phase patterns determined. Patterns that did not conform to the recognised structural and spatial criteria were designated as mixed. Caffeine-induced changes in the organisation of replication foci (G) were assessed by double labelling, as described in Figure 1H. High-power details are from the boxed areas shown. Scale bars (5 and 0.5 μm in Detail) are shown on individual images.