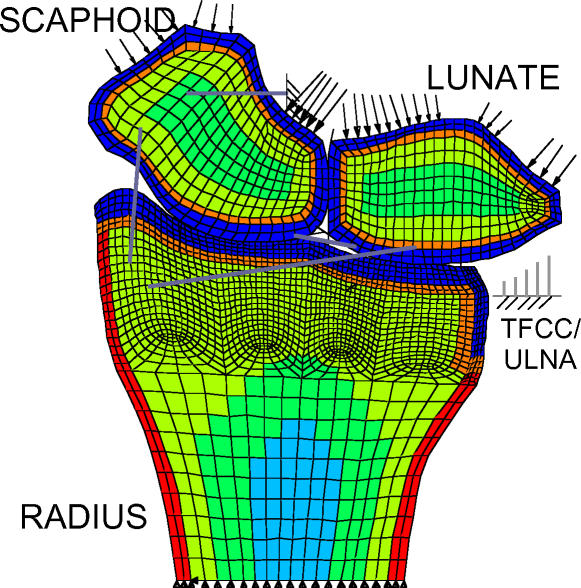
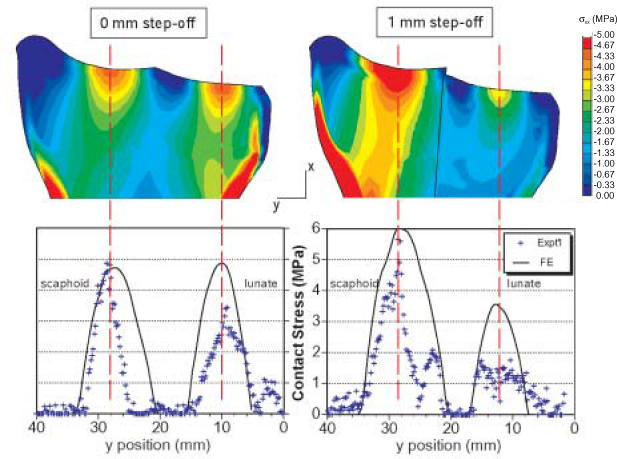
Figure 3 .
Contour plots of FE-computed stress distribution and graphs comparing computed contact stresses to those measured experimentally (NOTE: The symbols in the graphs are from a single experimental specimen).
Maximum Contact Stress (MPa).
| Step-off (mm) |
Experimental*
(mean±SD) |
FE |
|---|---|---|
| 0 | 4.79 ± 0.97 | 4.87 |
| 1 | 5.66 ± 0.98 | 6.07 |
| 2 | 7.22 ± 1.19 | 6.93 |
| 3 | 8.36 ± 2.15 | 7.73 |
n = 8 specimens


