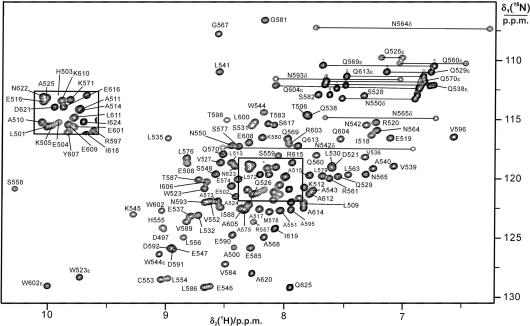
Figure 2.
15N-HSQC spectrum of τC14. The spectrum was recorded at 30°C with a 1.8 mM solution of uniformly 15N/13C-labeled τC14 in 90% H2O/10% D2O at pH 6.8 in phosphate buffer (10 mM phosphate, 100 mM NaCl, 1.0 mM dithiothreitol and 0.1 mM NaN3). The cross-peaks are assigned using one-letter amino acid symbols and residue numbers. Side-chain resonances are identified by Greek characters. Cross-peaks from side-chain amides are connected by horizontal lines.

