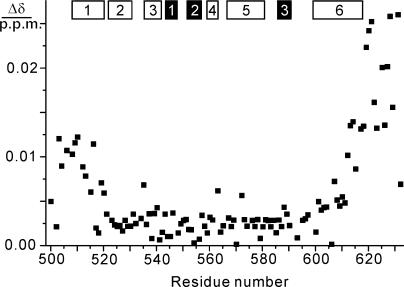
Figure 4.
Changes in amide chemical shifts of 15N-labeled τC16Δ11 observed upon binding of α at pH 6.8 and 25°C. The data were recorded with concentrations of τC16Δ11 and α of 90 and 120 μM, respectively. The chemical shift change Δδ was calculated as ({[Δδ(1H)]2 + [0.1Δδ(15N)]2}/2)1/2, where Δδ(1H) and Δδ(15N) denote the chemical shift changes in p.p.m. observed in the 1H and 15N dimensions of the 15N-HSQC spectrum. The locations of the α-helices and β-strands in τC14 are indicated by open and filled bars, respectively.

